PLEXIL Viewer
8 May 2015
NOTE: As of May 22, 2019, the current version of the PLEXIL viewer is broken – it has a number of startup and usage bugs. We hope to have someone working on this soon, but cannot guarantee anything. In the mean time, please use PLEXIL in its command-line form. If you are inclined to debug the viewer, the PLEXIL community welcomes any contributions! Please contact plexildiscuss@gmail.com.
Introduction
The Plexil Viewer (formerly “Lightweight Universal Executive Viewer”, or LUV), is a graphical interface for visualizing execution of Plexil plans. It allows you to specify a desired PLEXIL application, load plans and other supporting files, and monitor execution of a plan while being able to set breakpoints and interactively pause and resume the execution.
The PLEXIL Viewer allows you to execute Plexil plans using any of the three Plexil applications provided in the PLEXIL software distribution:
The Test Executive
The Plexil Simulator
The PLEXIL Executive
External PLEXIL applications running independently of the Viewer (documentation to be supplied)
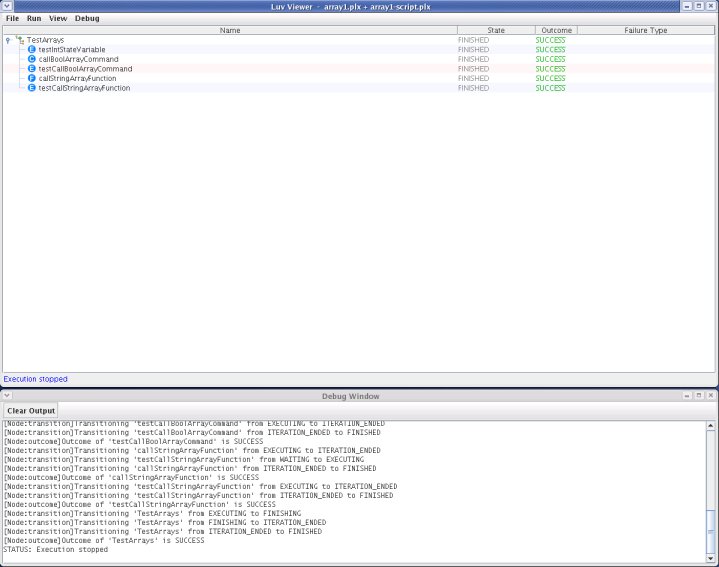
Here is an example of what plan execution looks like in the viewer.
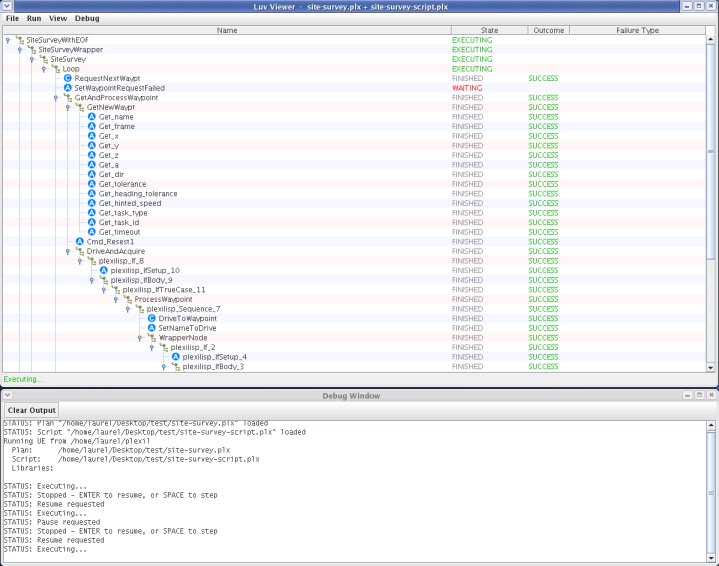
Using the PLEXIL Viewer
There are two different ways to use the PLEXIL viewer.
Command line: Run the PLEXIL application from the Unix command line, specifying the viewer as command line options.
Graphical: Start the PLEXIL viewer, and from here select and run the desired application.
The following sections describe both the command line and graphical means for running PLEXIL applications. We give detailed instructions for running the Test Executive application. The process for running the other PLEXIL applications with the PLEXIL viewer is almost identical.
Executing Plans with the Test Executive
See the PLEXIL Simulators chapter for an
introduction to the Test Executive and plexiltest command.
Command line approach
Type one of the following, equivalent, commands at a Unix prompt. (The second is an abbreviated form of the first).
plexiltest -viewer -blocking -plan plan_file -script script_file
plexiltest -v -b -p plan_file -s script_file
The -viewer or -v option says to open a viewer.
The -blocking or -b option says to open the viewer in blocking
mode, which means that plan execution is controlled interactively: the
space bar advances the plan by one
step, and the return key pauses and
resumes plan execution. This option is also required to allow setting
breakpoints in the plan. Note that use of this option significantly
slows the execution of the plan.
Graphical approach
Start the viewer by typing
plexil(see additional detail in the subsection below).Select
File/Configuration, which opens the configuration dialog (see image below).Click the
PlexilTestbutton.Click
Plan, which opens a file browser. In this browser, find and select the desired Plexil plan (.plxfile).If your plan uses library plans that are not found directly in the same directory as the plan, click
Librariesto select the needed library plans. See the section on adding libraries below.Select a simulation script. If your plan uses the empty script or a script file having the same base name as the plan, click the
Use Defaultbutton next to theScriptbutton. Otherwise, clickScript, which opens a file browser. In this browser, find and select the desired simulation script (.psxfile).Click
OKto capture these selections.To execute the plan, select
Run/Execute Planin the main Plexil Viewer window or menu bar.
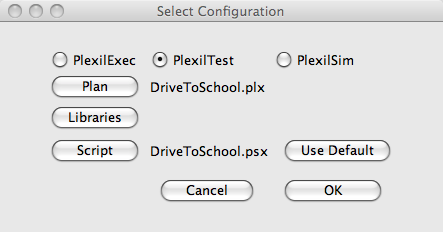
config-dialog
Starting the PLEXIL Viewer
The PLEXIL viewer is started by typing plexil at a Unix shell
prompt. A single window will appear, showing the PLEXIL logo. On Linux
systems, the top of this window will have a set of pulldown menu
selections. Under MacOS, the pulldown menus appear in application menu
bar at the top of the computer screen.
Executing Plans with the Plexil Executive
See the PLEXIL Executive chapter for an
introduction to the Plexil Executive and plexilexec command.
Command line approach
Type one of the following, equivalent, commands at a Unix prompt. (The second is an abbreviated form of the first).
plexilexec -viewer -blocking -plan plan_file -config interface_config_file
plexilexec -v -b -p plan_file -c interface_config
Note that the interface configuration file (-c/-config options) is optional. If omitted the default (“dummy”) configuration file is used.
Graphical approach
This approach is identical to the graphical approach for running the
Test Executive described above, except that the PlexilExec and
Config buttons are selected in the configuration dialog. The
Config button opens a file browser for selecting an interface
configuration file (XML format). If your plan does not need a specific
configuration file (i.e. it performs no external commands or lookups),
click Use Default to select the default (dummy) configuration.
Executing Plans with the Plexil Simulator
See Plexil Simulator
for an introduction to the Plexil Simulator and plexilsim command.
Command line approach
Type one of the following, equivalent, commands at a Unix prompt. (The second is an abbreviated form of the first).
plexilsim -viewer -blocking -plan plan_file -script simulation_script_file
plexilsim -v -b -p plan_file -s simulation_script_file
Graphical approach
This approach is identical to the graphical approach for running the
Test Executive described above, except that the PlexilSim button is
selected in the configuration dialog.
Advanced options
There are additional, more advanced, command line options relevant using any of the three Plexil application with a viewer.
Selecting a remote host
If the viewer is running on a different machine than the Plexil
executive, specify the viewer’s host using the -hostname or -h
option followed by the host’s name. You may also need to specify a port
number, as described in the next section.
Selecting a port number
The Plexil viewer connects with the Plexil executive using a Unix port. There are a series of consecutive port numbers (starting with 49100) that the PLEXIL software dedicates to this connection. Port selection is managed automatically such that multiple executives, each with a viewer, should be able to run concurrently on the same machine. There are several cases in which this automatic selection will not work, in which case a specific port number must be specified:
There are multiple viewers running, and the desired one is not using the first default port 65400 (e.g. it is not the first viewer started).
The desired viewer’s port number has been changed from its default selection (e.g. using the Debug/Change Server port option).
A specific port is specified on the command line with the -p option.
Here is what a full invocation of plexiltest might look like when
running with a remote viewer:
plexiltest -viewer -blocking -hostname foo.bar.com -port 49102
           -plan plan_file -script script_file
The above command line has been split to fit this document, but in practice should be all one line. Here’s the abbreviated form:
plexiltest -v -b -h foo.bar.com -n 49102 -p plan_file -s script_file
Saved Settings
The last settings used by the PLEXIL viewer are automatically stored in
the hidden file $HOME/.luv. There is normally no reason to inspect
this file, as it is managed by the viewer. Note that this setting file
will hold the last settings made in the last Plexil viewer that was
quit normally by a given user, even if multiple viewers had been used
simultaneously. If a viewer quits abnormally (e.g. crashes), the
settings file may not be updated.
Viewer Features
The following sections provide brief descriptions and snapshots of various PLEXIL viewer features.
Expand Plan View
Choose View - Expand All
Inversely, collapse plan view by choosing View - Collapse All
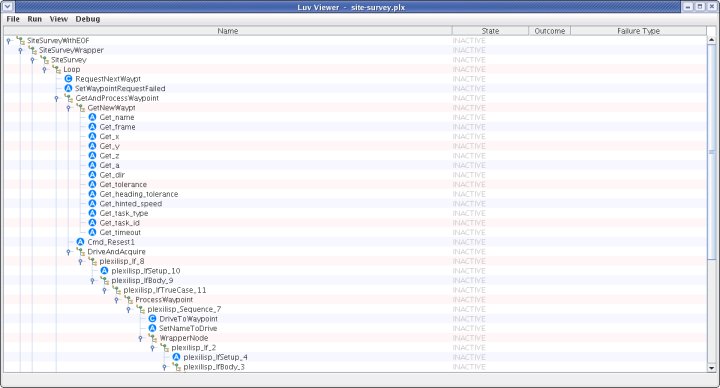
Node Information Window
DOUBLE-CLICK on a node to open node information window
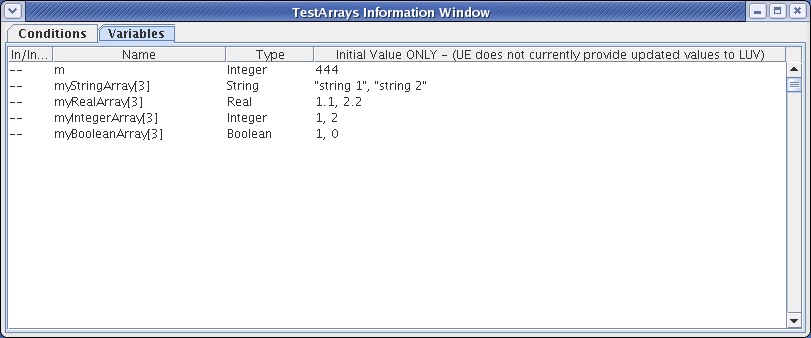
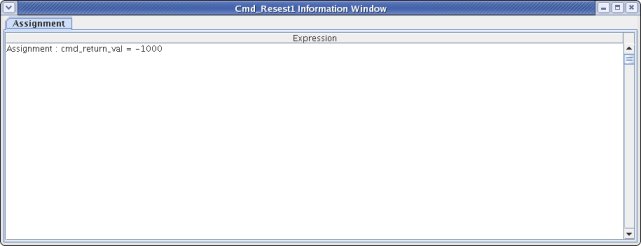
Depending on the node, the node information window could contain a Conditions Tab, Variables Tab and various Action Tabs:
Conditions Tab
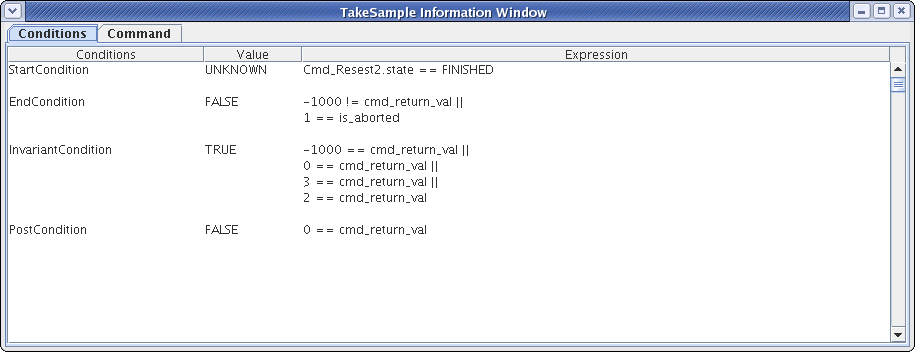
Variables Tab
Assignment Action Tab
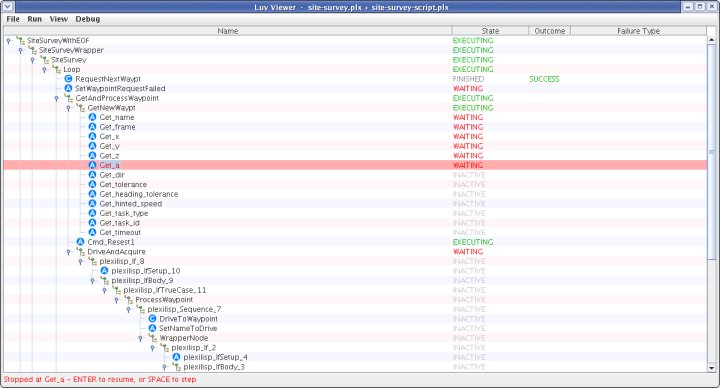
Plan Interruption and Breakpoints
Choose Run - Enable Breaks
RIGHT-CLICK (Mac OS: CTRL-CLICK) on node to add a breakpoint
Choose Run - Execute Plan
Plan will pause at beginning of execution
Press ENTER to resume plan execution
Press SPACE BAR to step through a plan
Stop Execution
During the execution of a plan, you are allowed the option of stopping the execution of a plan or reloading a plan.
Choose Run - Stop Execution, OR
Choose File - Reload
Create Debug Configuration File
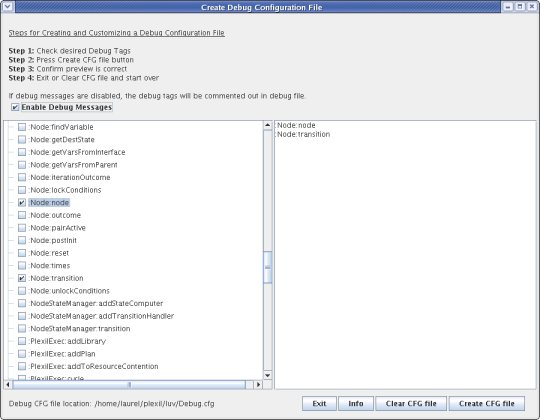
During the execution of a plan, Debug Tags trigger debugging messages to be sent from the executive. For example, the following Debug Tags would tell the executive to send messages for the state transitions and the final outcomes of every node:
:Node:transition
:Node:outcome
Choose Debug - Create Debug Configuration File…
Check the check boxes of the Debug Tags you want to enable and click Create CFG file
NOTE: a preview of the Debug.cfg file is displayed in this window and the location of the actual file is displayed in the bottom of this window
After the Debug.cfg file is created, the following additional information will appear in the Debug Window as you execute future plans
NOTE: to open Debug Window choose Debug - Show Debug Window
Find Nodes
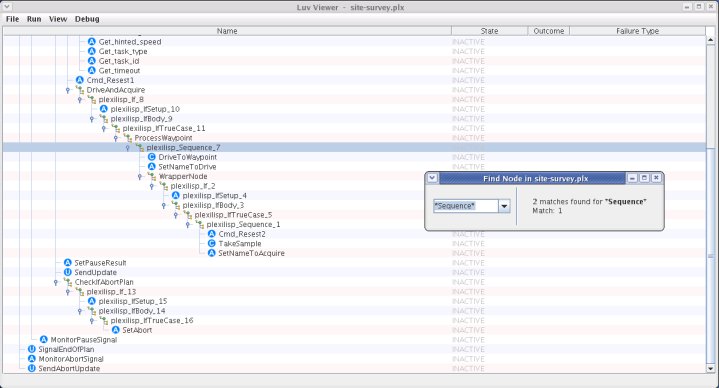
Choose View - Find…
Type the exact name of the node you wish to locate and press ENTER
To locate any node starting with a name you choose, type the partial name with a wild card (*) at the end and press ENTER
To locate any node ending with a name you choose, type the partial name with a wild card (*) at the beginning and press ENTER
To locate any node containing a name you choose, type the partial name with a wild card (*) at both ends and press ENTER
Hide Nodes
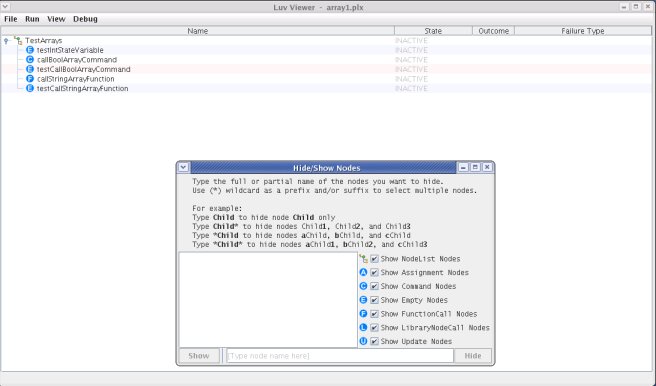
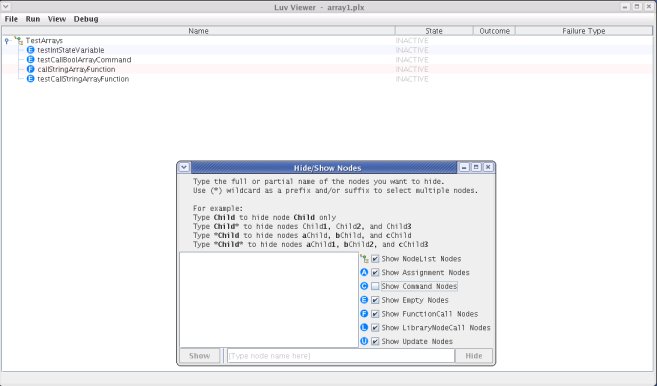
Choose View - Hide/Show Nodes…
Uncheck the check boxes of the node types you want to hide
Type the exact name of the node you wish to hide and click Hide
To hide any node starting with a name you choose, type the partial name with a wild card (*) at the end and click Hide
To hide any node ending with a name you choose, type the partial name with a wild card (*) at the beginning and click Hide
To hide any node containing a name you choose, type the partial name with a wild card (*) at both ends and click Hide
Temporal Plan Viewer
The Gantt/Timeline Temporal Plan Viewer (distinct from the Plexil Viewer
described above) allows for the post-execution visualization of PLEXIL
plans over time via a Gantt chart or a series of timelines. The viewer
can be used with plans run via the plexilsim or plexilexec executives.
The plexiltest executive does not allow for this feature.
Using the viewer
Add <Listener ListenerType=”GanttListener” /> to an interface configuration XML file associated with any plan(s) you wish to test with the viewer.
Run the plans you want to test with the viewer via
plexilexecorplexilsim.Open the HTML file that is stored in the same directory that you run plans from; each HTML file corresponds to the execution of a single plan. It is recommended that you use Mozilla Firefox or Safari; Google Chrome is not supported. The naming convention for HTML files is gantt_x_y.html where x is the system process ID of the plan’s execution and y is the name of root node in the executed plan. JSON files associated with each plan are stored in the same directory under a folder called “json” with the naming convention x_y.html where x and y are as stated above.
To observe specific information about a node, click on its token line. Within the draggable dialog window that opens, a number of node characteristics can be observed. Local variables in blue font indicate variables that have changed in value during that node’s execution. Additional display characteristics of the Gantt viewer window can be modified using the buttons at the top of the viewer. The functionality of these buttons is detailed below.
When finished, it is recommended that you click Reset to defaults within the HTML browser window you are viewing so that all cookies/local storage is cleared after each use. This will also prevent your display characteristics from persisting when viewing another plan in new window at a later time. If you would like to preserve your display settings, simply close the browser window.
Important additional notes
Javascript and cookies must be enabled within your browser.
Safari and Firefox are the only browsers tested successfully, with Safari working better.
In the case of long plans, the browser may prompt you to end a slow script because the viewer is taking longer than the browser’s permissible time to process the plan’s data. You’ll need to authorize the script to continue running. To prevent the prompt from showing up in Safari, you can:
:# Open Safari preferences, click the Advanced tab,
:# Check the box that says “Show Develop menu in menu bar,” and then
:# Click Disable Javascript Runaway Timer under the new Develop menu item that appears at the top of the screen. This will allow scripts to run to completion. In Firefox, the prompt will appear once, and you should then be able to check a box within the prompt window that prevents further prompts.
If tokens are not being displayed as you would expect, or certain tokens appear to be missing, it is best to first click Reset to defaults at the top of the viewer window. This will clear any settings that are stored via cookies and may be affecting the way in which tokens are being displayed.
The loading time for the viewer is variable, but long plans have been known to take many minutes to load. Shorter plans may load instantly.
The Gantt view can only be displayed after your plan has completed its execution. Trying to open a Gantt window during execution will either not work or a Gantt window corresponding to a prior plan’s execution will be displayed.
How it works
The viewer, written in Javascript, works by parsing data from a formatted set of JSON tokens and displaying tokens on timelines through use of this parsed data. The JSON tokens are generated in a single file by the Gantt Listener interface that gathers information from nodes when they reach their Executing, Finished or Failed states within a plan’s execution. Below is a screenshot of the viewer:
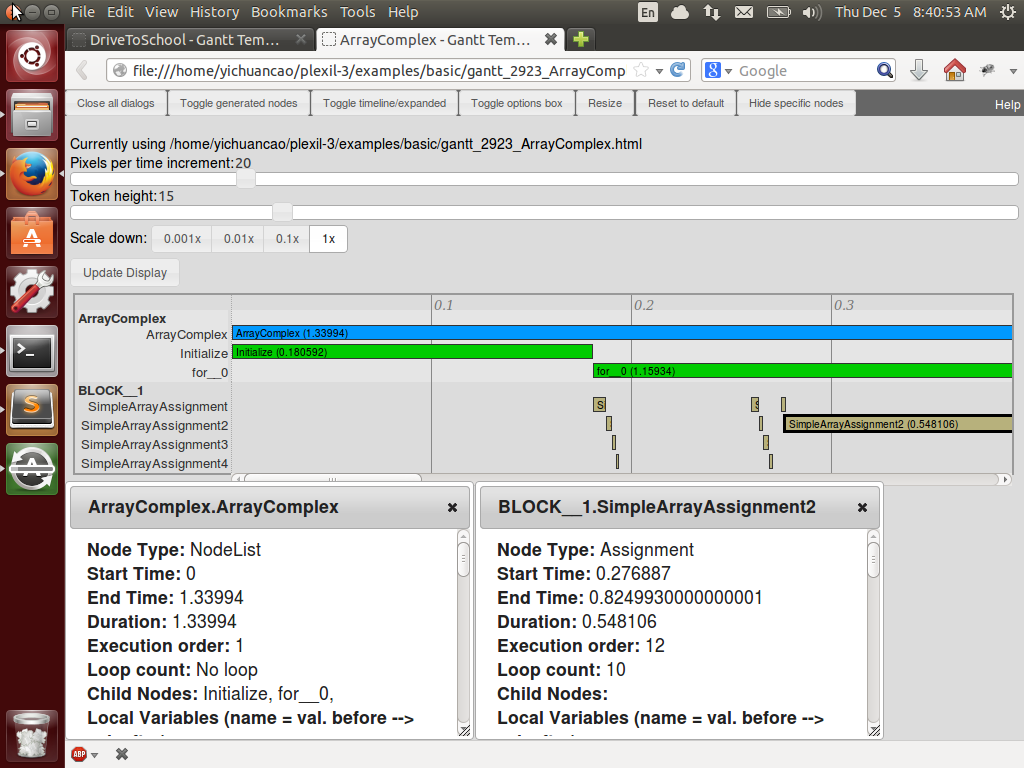
Timeline Temporal Plan Viewer
The root node of a plan has a blue token line, while its immediate children have green token lines. All other nodes have brown token lines. The bolded names on the left represent the names of parent nodes, while the names of each node represented on the token line are not bolded and are below their corresponding parents. Looping nodes are represented sequentially on the same token line. The Pixels per time increment options allows for the manipulation of the spacing between the dark grey gridlines that represent time increments. The Token height option modifies the height of each colored token box in pixels. These two options essentially allow for zooming in and out. The Scale down feature will more drastically modify the zoom of the plan by zooming out by powers of ten. The token lines themselves each display the name of the node they represent and the duration of the node’s execution.
Various buttons at the top of the Gantt Viewer window allow for the customization of the way tokens are displayed. Here is a brief description of each button’s functionality:
Close all dialogs - Closes any open dialog windows that are displayed node information (three are open in the screenshot above).
Toggle generated nodes - Displays or hides nodes that are generated by the PLEXIL executive during runtime; these are nodes that have names that are prefaced with ep2cp_, plexilisp_, or __CHILD__. By default, generated nodes are hidden.
Toggle timeline/expanded - Switches between an expanded Gantt-style view and a condensed timeline view. The Gantt-style view displays each node’s token on it’s own separate timeline. The timeline view condenses child node tokens to all fit on the line of their parent node. To observe concurrence, use the expanded Gantt-style view.
Toggle options box - Displays or hides the options box at the top of the viewer that allows control of certain display characteristics.
Resize - After resizing the browser window, clicking this button will resize the Gantt chart container within the viewer such that it’s width fits within the newly-sized window.
Reset to defaults - Destroys all existing cookie values such that the viewer window’s settings are returned to default. It is recommended that you click this after viewing a plan.
Hide specific nodes - Allows for the specification of specific nodes that should be hidden on the viewer. Either type the full name for each node or use the wildcard * character to represent a sequence of any characters. Separate node names with commas.